Health inequalities are avoidable, unfair and systematic differences in health between different groups of people. There are many kinds of health inequality, and many ways in which the term is used. That’s why, when we talk about ‘health inequality’, it’s useful to be clear about which measure is unequally distributed and between which people.
Note: This explainer was updated on 3 September 2025. It was previously updated on 17 June 2022 and originally published in February 2020.
Inequalities of what?
Health inequalities are ultimately about differences in the status of people’s health. But the term is also used to refer to differences in the care that people receive and the opportunities that they have to lead healthy lives – both of which can contribute to their health status. Health inequalities can therefore involve differences in:
- health status, for example life expectancy
- access to care, for example availability of given services
- quality and experience of care, for example levels of patient satisfaction
- behavioural risks to health, for example smoking rates
- wider determinants of health, for example quality of housing.
Inequalities between who?
Differences in health status, and the things that determine it, can be experienced by people grouped by a range of factors. In England, health inequalities are often analysed and addressed by policy across four types of factors:
- socio-economic factors, for example income
- geography, for example region or whether urban or rural
- specific characteristics including those protected in law, such as sex, ethnicity or disability
- socially excluded groups, for example people experiencing homelessness.
People experience different combinations of these factors, which has implications for the health inequalities they are likely to experience. This means that people grouped according to one factor, such as disabled people or people from a particular ethnic background, will not be homogeneous – there will be variation in health profiles and risks within any given population group. The way these factors combine and interact with each other also influences the health inequalities people experience. This is often referred to as ‘intersectionality’ – for example, women experiencing homelessness have distinct health risks and needs compared with men experiencing homelessness.
This explainer provides an overview of how health inequalities are shaped and experienced in England’s population. Where possible, we use the most recent data available, primarily data from 2021–2023.
Inequalities in life expectancy
Life expectancy is a key measure of a population’s health status. Inequality in life expectancy is therefore one of the foremost measures of health inequality.
Life expectancy is closely related to people’s socio-economic circumstances. The most common summary measure of these circumstances across a population is deprivation. The index of multiple deprivation is a way of summarising how deprived people are within an area based on a set of factors that includes their levels of income, employment and education as well as local levels of crime.
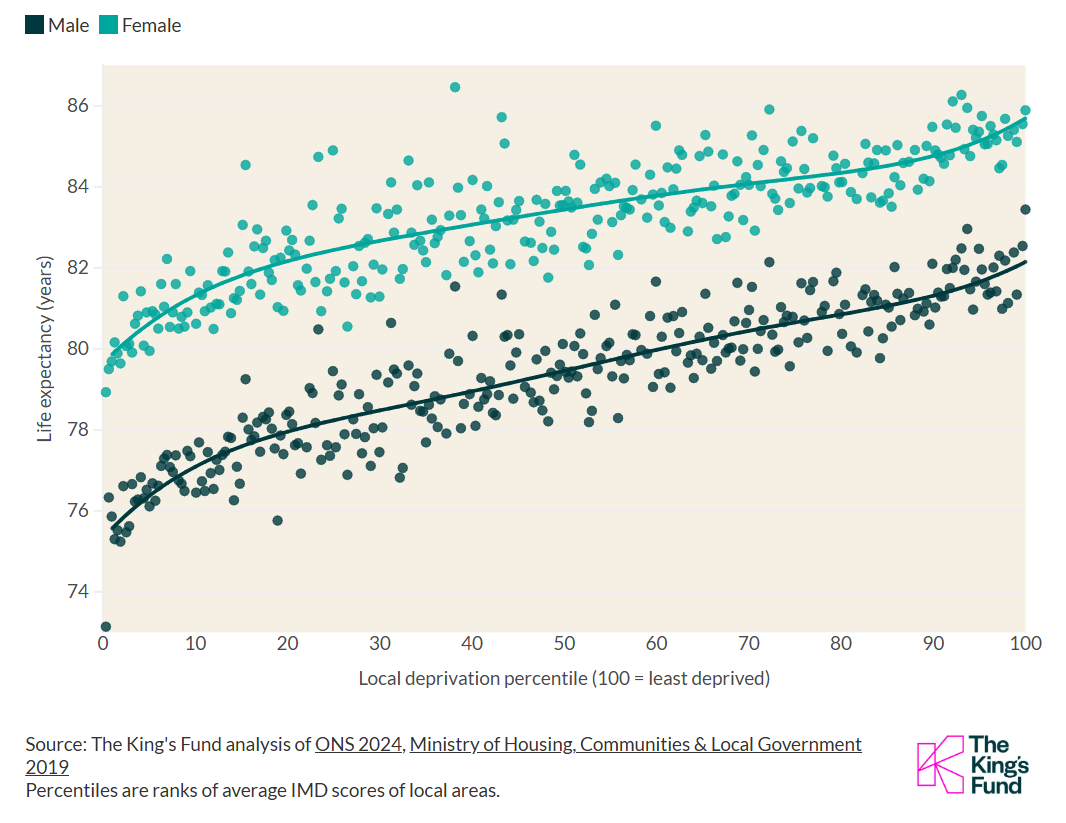
In England, there is a systematic relationship between deprivation and life expectancy, sometimes known as the social gradient in health. The most recent data available of this type shows that at a national level in 2020–2022, women living in the least deprived 10% of areas could, at birth, expect to live to 86.1 years old, whereas women in the most-deprived 10% of areas could expect to live to 77.7 years – a gap in life expectancy of 8.4 years. For men, this gap was even wider, with a difference of 10.4 years between the life expectancy for those in the least deprived 10% of areas (83.0 years) and the most deprived 10% of areas (72.6 years). In recent years, inequalities in life expectancy by deprivation have widened.
This social gradient relationship holds true across the whole population – health inequalities are experienced by everyone, not just between those at the very bottom and top. Figure 1 shows how during 2021–2023 in England local deprivation was linked to life expectancy.
Figure 1: Inequalities in life expectancy by local deprivation level
Life expectancy at birth (2021-2023) by local area indices of multiple deprivation (2019)
There are also geographical inequalities in life expectancy. In 2021–2023, the North East of England experienced the lowest life expectancy at birth for both men and women across England’s regions, followed by the North West. In the four most southerly English regions , life expectancy was higher than the England average, whereas in all other regions, life expectancy was lower than the England average.
The north of England has a higher concentration of deprived neighbourhoods than the south of England, and therefore a greater proportion of communities where life expectancy is likely to be lower based on their levels of deprivation. But in addition to this, for any given level of deprivation, life expectancy in the north of England is lower than in the south of England.
The differences in life expectancy at birth in 2021–2023 by local authority areas: For women, the gap between the area with the lowest life expectancy (Blackpool, at 78.9 years) and the area with the highest (Kensington, at 86.5 years) is 7.5 years. For men, the gap is 10.3 years, between Blackpool (73.1 years) and Hart, Hampshire (83.4 years).
Some population groups have significantly shorter life expectancy than the general population. For example, as of 2022, the median age at death for people with learning disabilities was 63 years, which is more than 20 years younger than the general population.
Inequalities in life expectancy exist between ethnic minority and white British groups, as well as between different ethnic minority groups. The picture of health inequalities by ethnicity in general is both complex and limited by imperfect data. Since 2021, the Office for National Statistics (ONS) has linked death records to other data sources, for example census and hospital records, to provide the best available national data on mortality by ethnicity. ONS statistics suggest that in 2021–23, mortality rates from all causes of death were lower for ethnic minorities than white British. This may be due in part to the ‘healthy migrant effect’, whereby people who migrate tend to be in good health, as well as lower rates of smoking and alcohol consumption in ethnic minority groups compared with white groups.
Inequalities in healthy life expectancy
Another key measure of health inequality is how much time people spend in good health over the course of their lives, given how crucial good health is to quality of life and people’s ability to do the things that they value.
A widely used measure for this is healthy life expectancy. This estimates time spent in ‘good’ or ‘very good’ health based on how people perceive and report on their general health.
The gap in healthy life expectancy at birth by deprivation is stark. The most recent data available of this type shows that nationally in 2020–2022, people living in the least deprived areas could expect to live almost two decades longer in good health than those in the most deprived areas. People in the most deprived areas spend around a third of their lives in poor health, nearly twice the proportion spent by those in the least deprived areas. This means that, on average, people in more deprived areas spend a greater part of their already far shorter lives in poor health.
Again, geographical inequalities exist in this measure. In 2021–23, healthy life expectancy at birth for women in the North East of England was 57.5 years, compared with 64.4 years for women in the South East, a gap of 6.9 years. For men, this gap was 6.6 years.
Inequalities in avoidable mortality
Deaths are considered avoidable if they could have been averted or delayed through timely, effective health care (known as ‘treatable mortality’) or wider public health and preventive interventions (known as ‘amenable mortality’). In 2023, more than 117,000 deaths in England (roughly 1 in 5) were considered avoidable.
Differences in rates of avoidable mortality between population groups reflect differences in people getting the help they need to address life-threatening health risks and illnesses. In England, in 2023, women in the most deprived areas were 3.5 times more likely to die from an avoidable cause than those in the least deprived areas. Men in the most deprived areas were 3.9 times more likely to die from an avoidable cause than those in the least deprived areas.
Blackpool had the highest rate at 454.4 deaths per 100,000, almost three times higher than the lowest area, which was Hart at 1118.1 per 100,000.
Inequalities in long-term health conditions
Long-term conditions are a major cause of poor quality of life in England. People on the lowest incomes or living in areas of high deprivation are more likely to acquire more multiple long-term conditions, and at a younger age, than people on the highest incomes or those living in areas of low deprivation. On average, people in the most deprived decile of the population develop multiple long-term conditions seven years earlier than those in the least deprived decile.
People identifying as white Gypsy and Irish Traveller report the poorest health and are most likely to report limiting long-term illness.
Inequalities in mental-ill health
Assessing differences in the prevalence of mental illness between social groups is challenging and complex, because rates of recognition, reporting and diagnosis are likely to vary between groups. Existing evidence is patchy and inconsistent, but data from a variety of sources highlights a range of differences in how mental illness and treatment for mental illness is experienced.
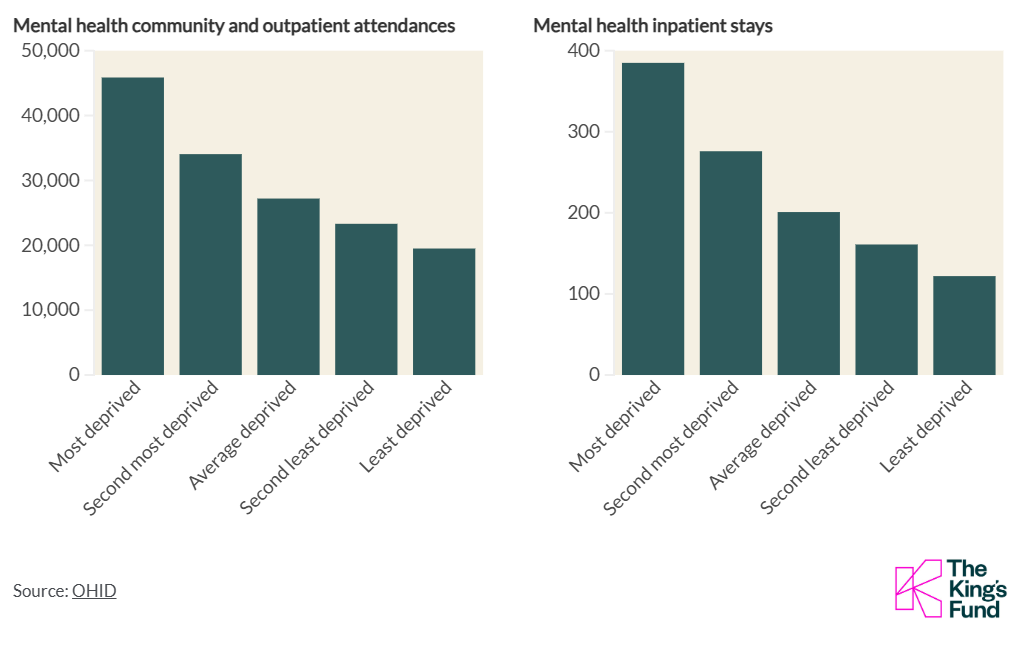
First, data suggests that demand for mental health services is higher among more deprived communities. Figure 2 shows that in England in 2019/20, both the rate of attended contacts with community and outpatient mental health services and the rate of inpatient stays in secondary mental health services were higher among more deprived populations.
Figure 2: Use of mental health services is higher in more deprived areas
Rate per 100,000 people, 2019/20
Second, existing evidence suggests that inequalities in various types of mental ill-health exist across a range of protected characteristics, including sexual orientation, disability, sex and ethnicity.
- People in the United Kingdom who identify as lesbian, gay, bisexual or transgender (LGBT) experience higher rates of poor mental ill-health and lower wellbeing than those who do not identify as LGBT.
- In a 2022 ONS survey, disabled people were more likely to report symptoms of depression.
- Suicide rates are more than three times higher in men than in women (2021–23), whereas women in England were more likely than men to report experiencing a common mental health disorder, according to the 2023/24 Adult Psychiatric Morbidity Survey
- The Adult Psychiatric Morbidity Survey from 2014 showed disparities in mental ill-health by ethnicity in England. For example, rates of psychotic disorder experienced by Black men (3.2%) and Asian men (1.3%) were higher than among white men (0.3%), although for women no significant difference by ethnicity was observed.
Several socially excluded groups have been shown to experience higher rates of mental ill-health than the general population. For example, more than 80% of people experiencing homelessness report having a mental health difficulty, and in 2021 people in this group were 13 times more likely than those in the general population to die by suicide. Asylum seekers and refugees are also at increased risk of experiencing depression, post-traumatic stress disorder and other anxiety disorders.
There is also substantial evidence of ethnic differences in pathways into psychiatric care across England. For example, in 2023/24 use of the Mental Health Act among the Black or Black British group were three and a half times higher than the white group. In addition, access to mental health services through general practice has been found to be less likely for people in the Black group compared with people in the white group. This has been linked in part to higher rates of serious mental illness in this group as well as to racism and discrimination within services.
Inequalities in access to and experience of health services
Access to health services refers to the availability of services that are timely, appropriate, easy to get to and use, and sensitive to user choice and need. Inequitable access can result in particular groups receiving less care relative to their needs, or more inappropriate or sub-optimal care, than others, which often leads to poorer experiences, outcomes and health status. Access to the full range of services that can have an impact on health includes access to preventive interventions and social services, as well as primary and secondary health care.
Inequitable access might mean that a group faces particular barriers to getting the services they need, such as real or anticipated discrimination or challenges around language. It can mean that information is not communicated in an easily understandable or culturally sensitive way. These issues are often reported for asylum seekers and refugees and Gypsy, Roma and Traveller communities, in particular.
Access can be measured in terms of service availability and uptake. People living in poverty and more deprived areas tend to find it harder to access services. For example, more deprived areas tend to have fewer GPs per head and lower rates of admission to elective care than less deprived areas, despite having a higher disease prevalence.
Different social groups might also have systematically different experiences within the services that they use, including in terms of the quality of care they receive and whether they are treated with dignity and respect. For example, a recent review commissioned by the NHS Race and Health Observatory found evidence of women from ethnic minority backgrounds experiencing ‘stereotyping, disrespect, discrimination and cultural insensitivity’ when using maternal and neonatal health care services. To take another example, in a study commissioned by Stonewall, 13% of LGBT respondents reported experiencing unequal treatment from health care staff because they were LGBT, with this number rising to 32% for people who are transgender and 19% for LGBT people from ethnic minority backgrounds. The differences between groups in this latter example demonstrate how using intersectional lenses gives us a more precise picture of health inequalities.
The examples previous show systematic differences across various measures of health for different population groups in England. This section explores differences in the likelihood of engaging in healthy or unhealthy behaviours, and differences in the wider determinants of health. Both involve differences in the health risks that people are exposed to and in the opportunities they have to lead healthy lives.
Behavioural risk factors
People’s behaviour is a major determinant of how healthy they are. Smoking, poor diet, physical inactivity and harmful alcohol consumption are leading risk factors that drive preventable ill health and premature mortality in England. Behavioural risks to health are more common in some parts of the population than in others. The distribution is patterned by measures of deprivation, income, sex and ethnicity, and risks are concentrated in the most disadvantaged groups. For example, in England in 2022, the proportion of adults who were smokers in the lowest income quintile was 21%, compared with 9% in the highest income quintile.
Higher-risk health behaviours also tend to cluster together in certain population groups, with individuals in disadvantaged groups more likely to engage in more than one risky behaviour. The prevalence of multiple higher-risk behaviours varies significantly by deprivation.
Health-related behaviours are shaped by cultural, social and material circumstances. For example, recent analysis suggests that, after housing costs, the poorest fifth of UK households with children would need to spend 70% of their income on food in order to follow the government’s official guidance on a healthy diet – compared with only 12% of income for the richest fifth of households.
Furthermore, evidence suggests that some people’s circumstances make it harder for them to move away from unhealthy behaviours, particularly if they are worse off in terms of socio-economic factors such as debt or poverty. This is compounded by differences in the environments in which people live – for example, in 2024 the most deprived decile of area had twice as many fast food outlets per person than the least deprived decile of areas. This indicates that interventions aimed at changing behaviours need to be able to adapt to the reality of people’s lives, addressing the contexts in which behaviours take place and recognising the challenges of achieving behavioural change under conditions of stress.
The wider determinants of health
The wider determinants of health are the social, economic and environmental conditions in which people live that have an impact on health. They include income, education, access to green space and healthy food, the work people do and the homes they live in. It is widely recognised that, taken together, these factors are the principal drivers of how healthy people are, and that inequalities in these factors are a fundamental cause of health inequalities. Addressing these wider socio-economic inequalities is therefore a crucial part of reducing health inequalities.
Table 1 provides some examples of health impacts relating to a range of wider determinants. The examples focus on individual determinants, but these determinants are often experienced together and cumulatively over time. Particular groups can be disadvantaged across a number of factors, and these disadvantages can be mutually reinforcing.
Table 1:
| Sector | Example |
|---|---|
| Income | Income determines people’s ability to buy health-improving goods – from food to gym memberships. Living on a low income is a source of stress, and emerging neurological evidence suggests that being on a low income affects the way people make choices concerning health-affecting behaviours.
People in the bottom fifth of income distribution are twice as likely to develop mental health problems than those on the average income. |
| Housing | Poor-quality and overcrowded housing conditions are associated with increased risk of cardiovascular and respiratory diseases, depression and anxiety.
Households from minority ethnic groups are more likely than white households to live in overcrowded homes and to experience fuel poverty. |
| Environment | Access to good-quality green space is linked to improvements in physical and mental health, and lower levels of obesity. Levels of access to green space are lower on average for people from ethnic minority communities and people living in areas with lower average incomes.
Exposure to air pollution is estimated to cut short 30,000 lives a year in the United Kingdom. Differential levels of exposure are associated with both deprivation and ethnicity. |
| Transport | Those living in the most deprived areas are twice as likely to be a casualty in a road accident compared with those in the least deprived areas. Children and young adults in the most deprived areas are more likely to be killed or injured on the road than those in wealthier areas. |
| Education | On average among 26 Organisation for Economic Co-operation and Development countries, people with a university degree or an equivalent level of education at age 30 can expect to live over five years longer than people with lower levels of education. |
| Work | Unemployment is associated with lower life expectancy and poorer physical and mental health, both for individuals and their households. In 2023/24, employment rates in the least deprived decile were 80.9% compared with 69.1% in the most deprived decile.
The quality of work, including exposure to hazards and job security, determines the impact that work has on health. People from minority ethnic backgrounds experience higher levels of work stress than those from white groups. |
Interactions between the factors driving health inequalities
Our health is shaped by a complex interaction between many factors. These include the accessibility and quality of health and care services, individual behaviours and, most importantly, wider determinants such as housing and income. Health inequalities exist as a result of systematic variations in these factors across a population.
Inequalities in these factors are interrelated. First, disadvantages are concentrated in particular parts of the population. For example, as noted above, lower socio-economic groups tend to have a greater prevalence of higher-risk health behaviours, worse access to care, and less opportunity to lead healthy lives than higher socio-economic groups.
Second, these factors can reinforce each other to compound and magnify the health risks and challenges that disadvantaged groups face. For example, unemployment, as well as being associated with a direct negative impact on health, can harm future earning potential, thereby affecting other determinants of health such as income and poverty – which in turn can impact on health behaviours and decision-making processes.
Policies and interventions undertaken to tackle health inequalities need to reflect the complexity of how these inequalities are created and perpetuated, otherwise they could be ineffective or even counterproductive.
Covid-19 had an unequal impact on different population groups and has exacerbated existing health inequalities in England.
Mortality rates from Covid-19 have been higher in more deprived areas than in less deprived areas. Up to March 2022, the Covid-19 mortality rate was 2.6 times higher for the most deprived decile in England than for the least deprived decile. This contributed to widening inequalities in life expectancy between the most and least deprived areas: between 2019 and 2021, the gap in life expectancy grew by 0.7 years for women and by 1.1 years for men.
The pandemic also had a disproportionate impact on ethnic minority groups. The picture is complex and differs between ethnic groups and over time. Overall, ethnic minority groups have experienced higher mortality from Covid-19 than the white British group. From the beginning of the pandemic up to February 2022, overall mortality rates from all causes were higher for men and women in the Bangladeshi group, and men in the Black Caribbean and Pakistani ethnic groups, compared with the white British group. In other ethnic minority groups, all-cause mortality during the pandemic remained, as before the pandemic, lower than or similar to the white British group, despite higher Covid-19 mortality.
Disabled people experienced a greater risk of dying from Covid-19 than non-disabled people. Up to March 2022, the risk of death involving Covid-19 was 1.6 times greater for disabled women who consider their daily life to be ‘limited a lot’ (based on self-reported disability status in the 2011 census) compared with women without a disability, and was 1.4 times greater for disabled men who consider themselves ‘limited a lot’ compared with men without a disability.
Covid-19 restrictions and the reprioritisation of health care services to manage demand associated with Covid-19 also affected some groups more than others. Disabled people were more likely than non-disabled people to report both that Covid-19 restrictions had a negative impact on their lives and that their medical treatment was disrupted during the pandemic.
The longer-term impact of the pandemic is likely to widen health inequalities even further unless urgent and significant action is taken. Analysis by The King’s Fund has shown inequalities in the elective care backlog, with people in the most deprived areas twice as likely to be waiting over a year for care compared with the least deprived areas. Health inequalities are also likely to be exacerbated by growing disparities in the wider determinants of health linked in part to the pandemic, including around education, unemployment and financial insecurity.
Based on factors outside of their direct control, people in England experience systematic, unfair and avoidable differences in their health, the care they receive, and the opportunities they have to lead healthy lives.
Health inequalities are not inevitable, and the gaps are not fixed. Evidence shows that a comprehensive, multifaceted approach to tackling them can make a difference.
Concerted, systematic and sustained action is needed to address the multiple and overlapping web of factors that drive health inequalities – from differences in experiences and quality of health care through to the wider determinants of health. This includes, but goes well beyond, the health and care system. It requires working in partnership across services, sectors and communities, at local, regional and national level.
To find out more about current policy and opportunities for action on health inequalities, you can read further content from The King’s Fund on:
- The King’s Fund’s seven priorities for the NHS to tackle health inequalities
- NHS England’s ‘Core20plus5’ approach to health inequalities
- Lessons from the past on what works in tackling health inequalities
Source: This content was originally published by The King’s Fund. All credit goes to the original author.